Visual Data Analytics?! Power BI?! What on earth is that?
I recently had a conversation with a close friend of mine – a project controls professional like myself.
We got around to talking about the methods we use to analyze our data.
He complained that the weekly data he is gathering from his project is so vast that he takes days to make sense of it.
I told him that the solution is already out there, and I recommended that he start using Power BI.
Well, his reply was, “Eh? What’s that now?”
Sound like you?
Not to worry! You are not alone in this.
There are tens of thousands of project controls professionals out there who have never heard of Power BI before.
Data in its raw form are useless and are just unprocessed facts. However, analyzing all this data will provide insights or otherwise logical conclusions derived from the data that can benefit your project. In other words, data is the input, and insights are the output.
So, do you convert your data to generate actionable insights?
Do you give power to your data?
Or are you spending countless hours processing your project data to realize that the data you have is already outdated?
If you are that person, it’s time that you start leveraging Power BI to make sense of your data and take quick and sound decisions in your projects.
So, what is Power BI?
Power BI is a powerful visual data analytics service offered by Microsoft designed to make your life easier, sparing you all those tedious hours spent consolidating data and developing graphical reports.
Power BI provides interactive visualizations and business intelligence capabilities with an interface simple enough to create your project reports and dashboards. It effectively unifies data from many sources to create actionable insights which can help you drive your project outcomes.
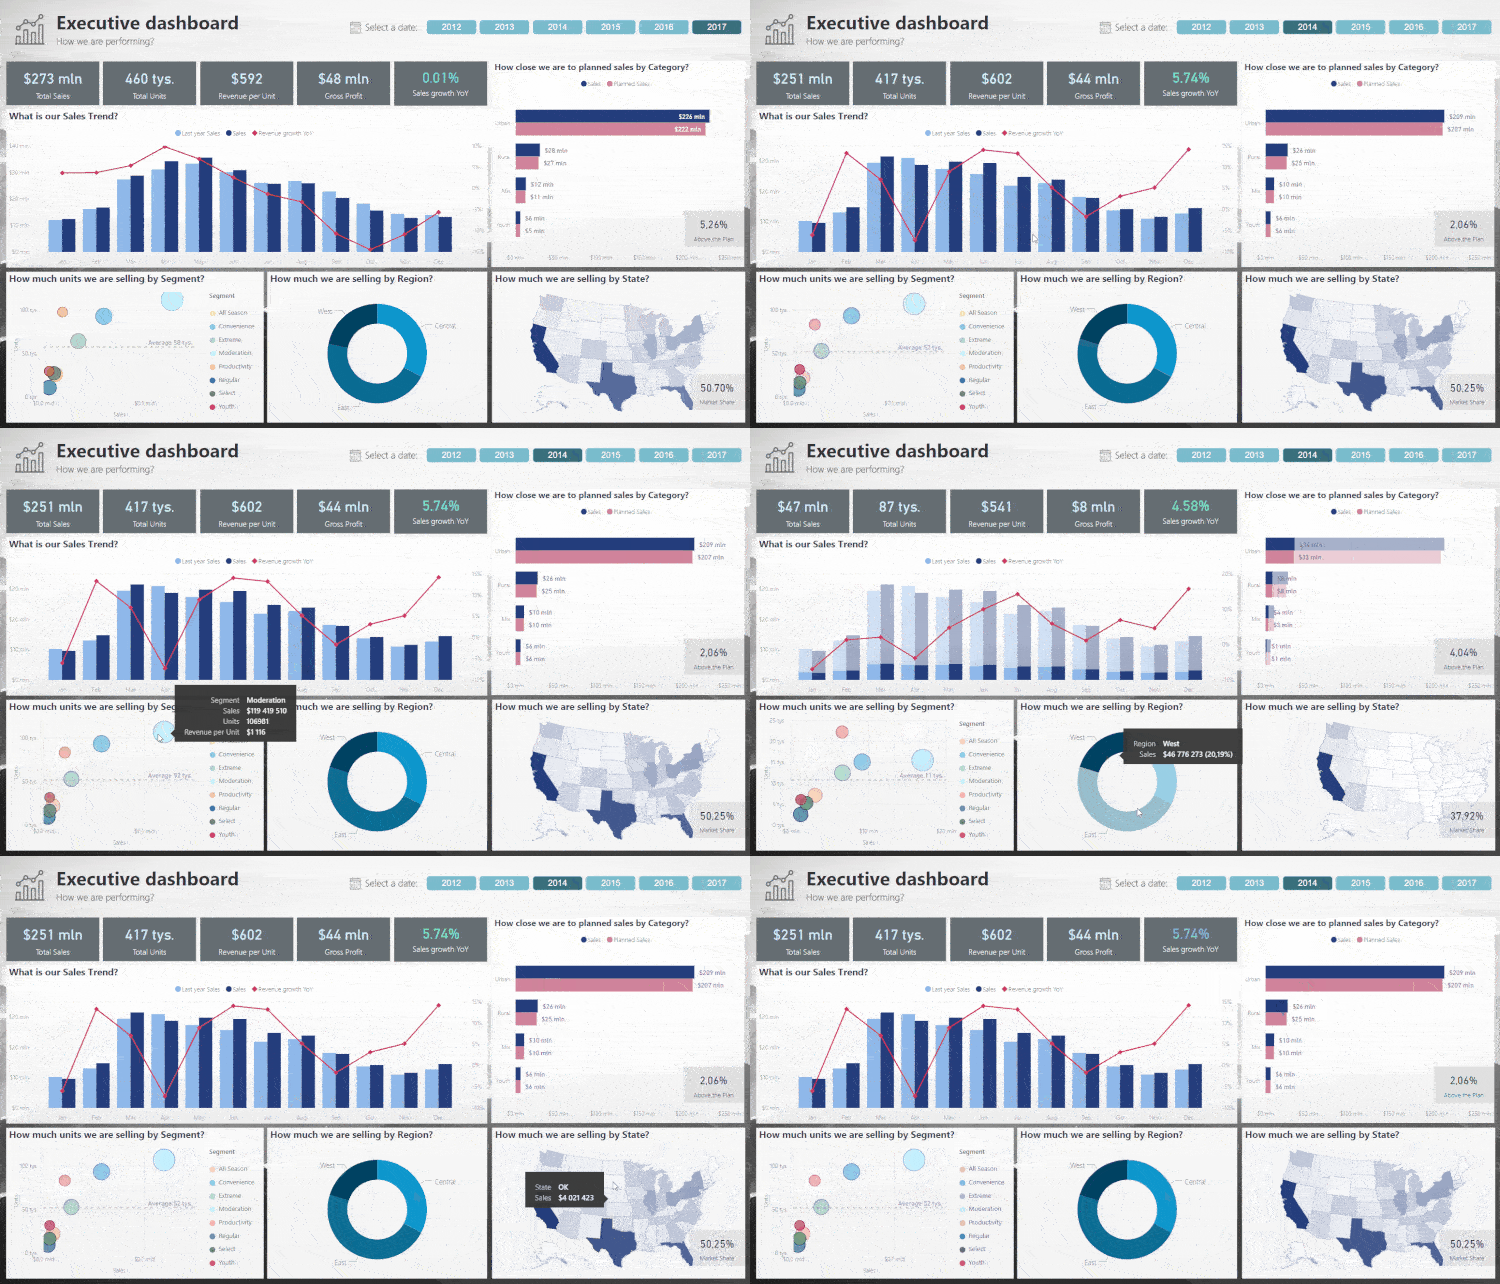
Power BI compared to other tools have many advantages and is very simple to use.
End users do not need to have a technical knowledge and skills to create advanced reports and dashboards.
Here are three reasons why you should consider integrating Power BI in your projects visual data analytics.
Power BI Connects to Different Types of Data Sources
The fantastic news is that it is possible to connect Power BI to almost any data source.
You might be using different project management software’s like Primavera P6, MS Project, or SAP. You can connect all these data sources directly to Power BI.
In fact, Power BI allows more than 45 data connectors, which keeps adding on every month!
To get more information on different data sources you can connect to Power BI and the Power BI data connection process, check this out.
This direct connection to data sources enables you to remove all middle steps in getting updated data and allows you to automate your reporting cycle.
Power BI Allows You to Share Your Visual Data Analytics Insights with Everyone with Ease
You might have had so many instances where information has gotten lost in communication.
Perhaps, there were times when you lost track of changes to the latest revision of data among your piles of emails, or you had a hard time emailing a big project report file and couldn’t share a critical insight from the project with a stakeholder.
Power BI helps solve these issues.
Power BI stores all local information and data in the cloud in one centralized location that can be accessed anytime, anywhere.
Power BI also allows you to embed your reports on collaborative platforms like Microsoft Teams and SharePoint, so you can share your reports and visual data analytics with the right people, anywhere in the world.
So, practically all you need to share is the web link, giving all stakeholders access to the interactive reports, and your stakeholders don’t need to download Power BI to view your dashboards or reports.
Designing Interactive Visual Data Analytics Dashboards Is Made Easy with Power BI
If you have designed a dashboard, executive report, or a graph on Excel, you know how much effort it requires to build an impressive graphical report.
Did you know that without any knowledge of Excel, with just some drag and drop features from Power BI, you can create highly impressive interactive reports and dashboards?
Power Bi has a very extensive library of interactive visualizations, like pie charts, bar charts and waterfall charts, among many others. All you need to do is just drag and drop. That’s it!
If you still don’t believe me, check this video on how you can build impressive visual data analytics dashboards with Power BI so fast!
And the best thing? It’s free to download and start using it!!
The image below summarizes Power BI application in a nutshell:
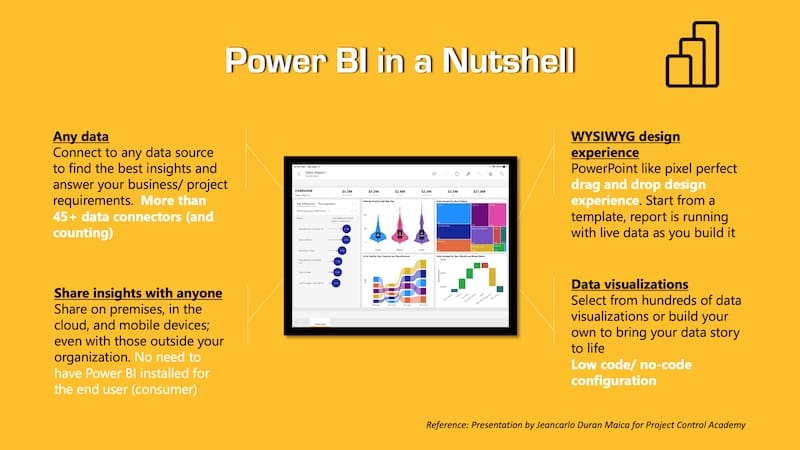
Why should you learn Power BI and start using it in your projects?
I know now many of you must be dreading the entire process of learning to use a new tool. But I have already mentioned above that the software’s advantages far outweigh any learning curve involved.
As project professionals, most of us have been toying around with Excel to analyze our data, and it’s time to go to that next level of doing much more in a lesser time frame.
Automate Your Project Reports and Workflows
Imagine automating your entire project controls reporting cycle and generating reports within seconds!
If you are like me and dread making reports, this one reason should be enough to start learning Power BI today.
Provide Real-Time Visibility Into Your Projects’ Status & Performance
It’s time you consider moving away from the traditional way of using Excel and start using Power BI for your project reports.
We can extract information directly from the data source to the Power BI platform. You can directly connect your data source like P6 to Power BI, and any change made in P6 reflects on your Power BI dashboard. And better still, these insights are available to all the project stakeholders in real-time, allowing everyone to make informed decisions.
Sounds too good to be true, right?
Advanced Visual Data Analytics and Graphics
Power BI gives us the flexibility to develop highly customizable and interactive dashboards, which is impossible using any project scheduling tools like P6 or Microsoft Project.
Deep Dive Analysis of Your Project Data
You are no longer constrained to high-level information. Power BI gives you the freedom to drill down your visuals and examine project data at a granular level.
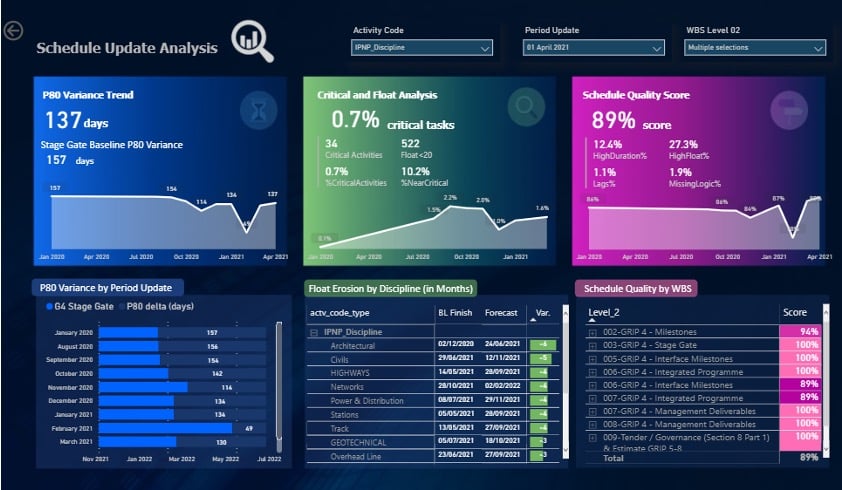
Graph: Created with Power Bi by Jeancarlo Duran Maica
In Summary
Power BI can be a potent tool for every project control or project management professionals out there.
There is no need to cringe about the data that you have to spend days processing anymore. The solution is out there for all of us.
The question is, ” Are you ready to take that first step towards taking your data analytics and reporting skills to the next level?”
Power BI is free to download, and I encourage you to take that first step today. Head on to the Microsoft App Store and download the free software.
Start taking baby steps today towards mastering Power BI! The good news is that Project Control Academy is here to help you in this journey. Join us for the hands-on online training workshop on Power BI Visual Data Analytics for Project Controls.
We look forward to being a part of your journey!
Special Thanks!
The team at Project Control Academy thanks Jeancarlo Duran Maica for sharing his knowledge on Power BI in this engaging video interview.
About the Writer & Editor, Joel Jacob

With over 6 years of project management experience in the construction industry, Joel is a keen follower of new technologies. Joel has worked across diverse roles in project management, including PMO, project controls, and the customer experience in Kuwait and India. He holds a postgraduate degree in Construction Management and a bachelor’s degree in Civil Engineering.
His true passion is driving people to achieve the best in their careers. Joel is also a certified Project Management Professional (PMP) recognized by the Project Management Institute (PMI) and an accredited LEED Green Associate.
Connect with Joel via LinkedIn.
About Power BI SME, Jeancarlo Durán Maica

Jeancarlo has impressive capability in all planning & controls disciplines in an array of different project environments including leading large teams & project setup. He holds different professional certifications including Primavera P6 EPPM Implementation Specialist, and MCP (Microsoft Certified Data Analyst Professional).
He has been an active member of AACE International, founding the AACE Peru Section in 2013 and serving on the Board of Directors of AACE International 2017-2019 as Director-Region 10 (Latin America).
Jeancarlo is currently working as a Digital Planning and Reporting Manager for BAM Nuttall on a multi-million pound rail project in the UK (Transpennine Route Upgrade), connecting Manchester to Leeds.
Connect with Jeancarlo on LinkedIn.




![[Free 90-min Masterclass] The Ultimate Leadership Recipe for Project Professionals](https://www.projectcontrolacademy.com/wp-content/uploads/2024/08/4-1024x576.jpg)


