Digital disruption! Risk signals!
Sounds familiar?
Ever wondered how project delivery teams can realize their full potential in an era of digital disruption?
Do you know how risk signals can enable an intelligent risk management strategy?
In this blog post, you are about to explore how bias and noise influence project risk, and ways in which you can optimally combine both risk theory and risk data to help amplify and manage relevant risk signals.
Introduction to Risk Signals
There is much hype today about digitalization, and for good reason. The next decade has the potential to be transformative for the construction industry, offering productivity gains other industries enjoyed during the twentieth century [1].
Affordable, powerful computing and the widespread availability of quantitative risk analysis (QRA) software has helped democratize data analytics in project delivery. This is great for the project controls profession and industry at large. However, problems arise when:
- A. Project simulations are created without a thorough appreciation of the need for ongoing or continuing project risk management,
- B. Risk terminology or processes are invoked that generate bias or noise, undermining risk data quality, potentially, creating more harm than good.
In this blog post, you will explore how project delivery teams may realize their full potential in an era of digital disruption. Essentially:
- How risk signals can enable an intelligent risk management strategy,
- How bias and noise hinder project performance,
- Explore ways in which Harford’s 3Cs (calm, context, and curiosity) may optimally combine both risk theory and risk data to help amplify and manage relevant risk signals.
Why Are Relevant Risk Signals Important?
Not all risk data is created equally.
Today, data democratization has permitted an unprecedented number of project professionals to employ software analysis tools that were previously only available to a limited number of risk practitioners. This, in itself, is a good thing. However, problems can arise when inadequate attention is given to both risk theory and risk data.
In his book titled, The Failure of Risk Management: How it is Broken and How to Fix it, Douglas Hubbard quips that, without proper care or understanding, much risk information can be, “worse than useless”, inadvertently triggering misdirection and causing self-inflicted harm [2].
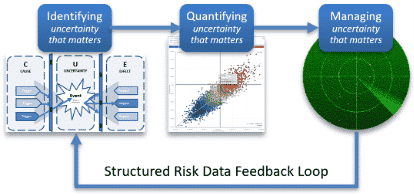
Figure 1 – The Circular Pathway of Relevant Risk Signals
The prize for optimally balancing risk theory and data is the discovery of relevant risk signals that aid prediction accuracy and proactively ensure successful project delivery. Intelligent risk management strategies are the exception rather than the norm.
Traditionally, there was neither much theory or data to aid the development and efficient use of cost contingency. It was common for developers, owners, or contractors to apply an arbitrary 5 or 10% contingency to account for unknowns. This may have been a pricing strategy or wishful thinking. The fact of the matter though is that very few projects can deliver on their promises using traditional or conventional thinking [3]. Additionally, incorrectly applying sophisticated methods, without appreciating underlying theory, may intensify the risk of failure.
See figure 1 and, for example, consider the consequences of quantifying risk in the absence of one or more of the other attributes required to propagate relevant risk signals. With this idea in mind, it is the organization that can isolate and amplify relevant risk signals, better than its peers, which will derive a risk-based competitive advantage. That is the ultimate commercial prize.
Intelligent Risk Management Strategies
In project controls, over the last twenty years, personal computers and spreadsheet software have made dynamic modeling the norm. Such software, although relatively simple by today’s standards, can be considered a form of artificial intelligence (AI). Additionally, and since Sam Savage has helped highlight the fallacy of point estimates (i.e., with his humorously succinct aphorism and book of the same name, The Flaw of Averages [4]), the ease with which teams can employ Monte Carlo simulation (MCS) software has made probabilistic modelling commonplace, although not necessarily the norm.
Technological revolution in project controls continues apace and, over the last 10 years, there has been much hype about the potential for relatively large, outsize datasets or big data.
Ultimately, the increasing abundance of structured project data and evermore capable computing power is enabling the application of AI in project delivery or, more accurately, the field of data science and advanced analytics (DSAA).
Data science is the field which has awakened many to a variety of exciting possibilities. For clarity, data science can be defined as, the analysis of data using the scientific method with the primary goal of turning information into action [1] [5].
Approximately fifteen years ago, thought leaders mused about intelligent risk management strategies [6] [7]. Such strategies rested on being able to weigh risk effectively. Apgar described that this involves:
- Classifying risk data
- Characterizing and calculating exposure
- Perceiving relationships
- Learning quickly
- Storing retrieving, and acting upon relevant information
- Communicating effectively
- Adjusting to new circumstances
Today, data science allows us to narrow the gap between risk management theory and practice. What was once manually intensive can now be readily automated. Successful project outcomes are not, however, a foregone conclusion. While data generation is now effortless, meaningful, actionable insight, to help enable predictable project outcomes, can only be generated if information is interpreted with domain experience and through an appropriate theoretical lens.
Without good appreciation for risk theory, team members cannot only identify the KPIs (key performance indicators) required to support strategic or critical decision-making. With a good understanding of risk theory, they can identify leading indicators that may serve as bellwether indicators of the project’s likely chance of success. These are sometimes referred to as KRIs or key risk indicators.
The Pareto principle infers that a fifth of these KRIs are the significant few that require the closest attention and prioritized intervention. Among the infinite number of signals available to us in a digital world, this subset of KRIs can be considered MVMs or minimally viable metrics.
An intelligent risk management strategy will produce MVMs that permit the weighing of confidence in both strategic and tactical perspectives. This can be achieved if a stochastic analysis is performed to both:
- A. establish the baseline budget (via quantitative risk analysis before execution), and
- B. establish confidence levels in the forecast to complete (throughout project execution).
For example, if a strategic decision was made to fund a project at the 50th percentile but analysis reveals confidence in the forecast to compete is lower, say, at the 30th percentile, this should provide incentive or good reason for the project team to intervene, reconcile the adequacy of the remaining contingency with known QRA (quantitative risk analysis) risks that have not yet occurred.
Corrective action, including scope reduction, may be necessary if analysis of relevant risk data highlights that the remaining contingency is not sufficient (to fund both known risks and any emergent risks that have materialized in the forecast since the project was first budgeted).
Judgement Error & Prediction Accuracy
Relevant risk theory requires us to be aware of, and account for, human behavior. Traditional economic theory postulated that people are rational actors. By contrast, modern behavioral economics acknowledges that people are predictably irrational [8] [9].
The accuracy of project plans or baseline estimates can be thought of as the byproduct of trueness and precision (see figure 2).
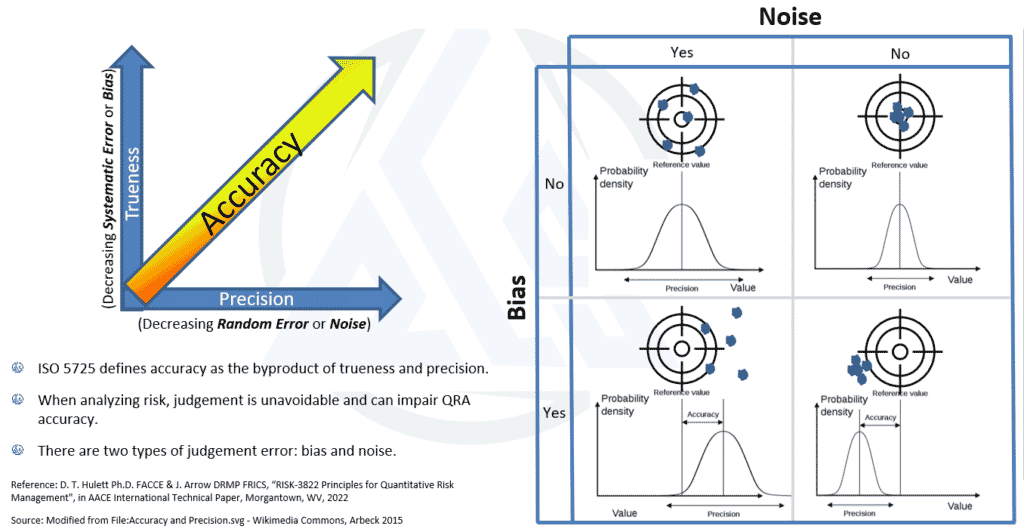
Figure 2 – Risk Analysis, Judgement Error & Accuracy
When analyzing risk, judgement is unavoidable, and two types of judgement error commonly impede prediction accuracy [10]. Precision is hampered by noise or random error. Trueness is constrained by bias or systematic error.
Tim Harford’s 3Cs
In a 2021 interview with the CATO Institute [11], about his book titled, The Data Detective: Ten Easy Rules to Make Sense of Statistics [12], Tim Harford shared a soundbite to succinctly summarize his ten (or perhaps eleven) rules.
He described the following three Cs: calm, context, and curiosity. These principles are, debatably, the most effective means for overcoming the two most common types of judgement error.
Calm
Daniel Kahneman, the 2002 winner of the Nobel prize in economics, described two systems that drive the way we think [13]:
- System 1 – fast, intuitive, effortless & emotional
- System 2 – slow, deliberate, effortful & logical
To help quickly make sense of a complex world, we intuitively employ System 1 thinking. This is fine if we are not making decisions of high consequence, however, like water seeking the path of least resistance, our thoughts gravitate to the path of least resistance. This is a problem because the heuristics (or rules of thumb) that hot, system 1 thinking employs, is fraught with biases (or subconscious, motivated reasoning [14]) that we are often blind to.
Such blindness may mean that slowing down, to reflect and employ cool / calm system 2 thinking, might not be enough. Numerous studies [3] [9] [15] [16] [17] support Kahneman in his assertion that, to overcome known limitations of expert judgement (or an inside view), an independent outside view should be used to verify or correct subjective estimates.
In recent years, Professor Bent Flyvbjerg, has highlighted that bias is the biggest risk, causing teams to underestimate required resources, inadvertently or deliberately [15]. Flyvbjerg concurs with Kahneman and has helped several government procurement agencies, around the world, successfully employ an outside view, using reference class forecasting (RCF), to help mitigate the influence of optimism and political bias.
Increasingly, project delivery teams are employing a hybrid approach to risk analysis where a conventional inside view is analyzed in parallel to a relatively novel or unconventional outside view [18].
Context
Where the trait of calm may have been more orientated towards data, the principle of context is perhaps more a byproduct of the risk practitioner’s capability, or project team’s understanding, of underlying risk theory.
For risk practitioners, there are many opportunities to enhance the context of their analyses. Most crucially, that effort should focus on the pragmatic quality of supporting risk data and, at the highest level of detail, the nature of unknowns under analysis (see figure 3).
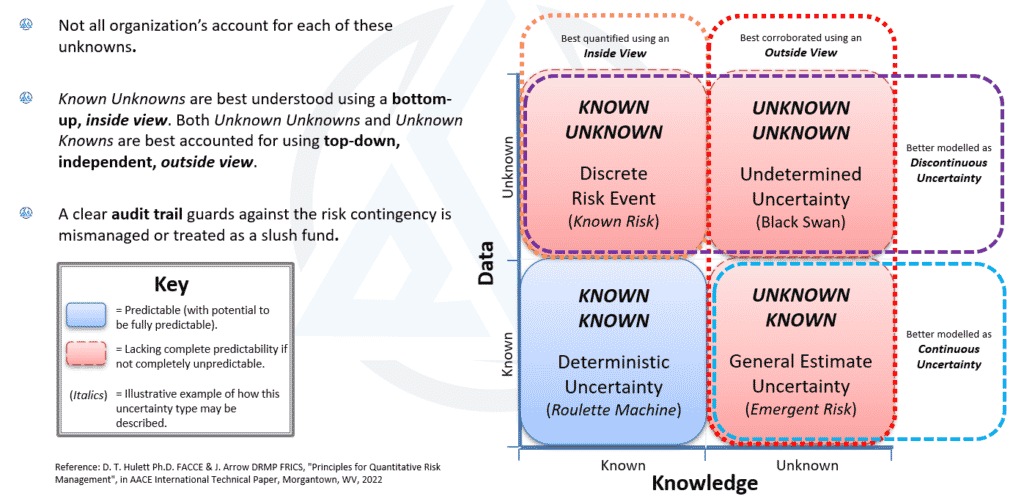
Figure 3 – Accounting for the Unknown
The Johari Window is widely used in many industries and an effective tool to help teams align on unknowns for modelling or continual risk management [10]. This tool can help ensure no uncertain angle is overlooked by project team members and, with unknown unknowns in mind, can help promote the consideration of ways in which an outside view can be accommodated.
At lower levels of detail, well-defined data standards within an organization should help automatically take care of metadata or what the international standard for data quality (ISO 8000) refers to as a syntactic quality. Good process assurance can help manage sematic quality or, more simply, correctly formulated calculations. However, when it comes to context, oftentimes risk analysis insight is constrained by poor pragmatic quality.
Without effortful and logical decomposition of risk(s) under consideration, organizations routinely base their most fundamental calculations and decisions on imprecisely defined problems.
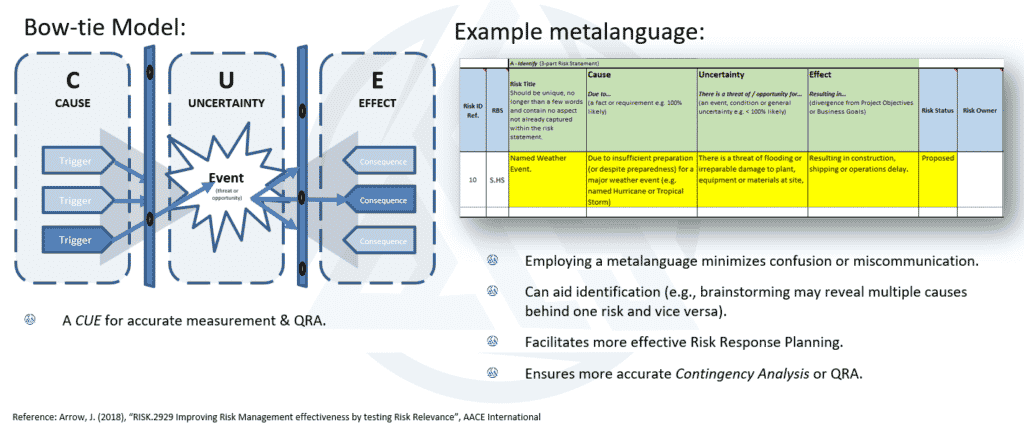
Figure 4 – Risk Bowtie & Metalanguage
The risk bow-tie model (see figure 4) is a simple but very effective tool for fleshing-out risk content at the lowest level of detail. For example, it can serve as a point of reference during discussion with team members to help delineate between cause and effect as well as proactive and reactive response action(s).
Employing a metalanguage to describe risk in a manner that mirrors the bow-tie model can help ensure risk relevance and priority is given only to “uncertainty that matters” [19]. Refer back to figure 1 to confirm the significance and underlying importance of this concept.
Finally, one additional opportunity for providing valuable project risk context is to move beyond what NASA refer to as risk informed decision-making (RIDM, otherwise referred to as QRA or quantitative risk analysis in other industries) and maintain effort in a subsequent phase of project control that they refer to as continual risk management (CRM).
Again, with good data standards and data management processes in place, this not only provides opportunity for targeted monitoring and timely intervention, but it also establishes the infostructure and feedback mechanisms required for continual improvement [20].
Curiosity
In his book titled, Superforecasting: The Art & Science of Prediction [16], and after decades of research focusing on prediction accuracy, academic Phil Tetlock famously stated that “the average expert is as accurate as a dart throwing chimpanzee”.
Tetlock’s work identified that those who displayed poorer Superforecasting were usually overconfident, and likely to declare things ‘impossible’ or ‘certain’. Unable to make any adjustment for their own biases and often committed to their conclusions, they were reluctant to change their minds even when presented with evidence that their predictions had failed. They are stuck in what Adam Grant calls an “overconfidence cycle” [17].
More pragmatic experts, Tetlock revealed, gathered as much information from as many sources as they could, as frequently as possible. They talked about possibilities and probabilities, not certainties. Additionally, they readily admitted when they were wrong, were open to new ways of thinking, able to update their beliefs and change their minds.
After year’s analyzing findings from The Good Judgement Project, Tetlock identified one factor that helped some people rise into the ranks of superforecasters: perpetual beta – “the degree to which one is committed to belief updating and self-improvement. It is roughly three times as powerful a predictor as its closest rival, intelligence.” [16]
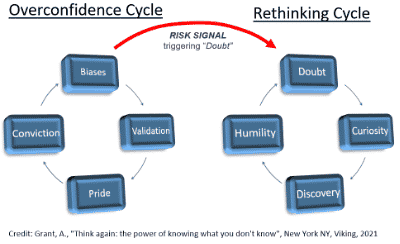
Figure 5 – Risk Signals triggering doubt and the Rethinking Cycle
Ultimately, it is intellectual humility that gives rise to doubt and opens the door to discovery and an experimental mindset (see figure 5 [17]).
A learn-it-all culture (as opposed to a know-it-all culture) provides teams with the flexibility to recycle, test ideas and continually improve. Unrelenting curiosity facilitates a perpetual beta way of working, allowing organizations to reduce the assumption-to-knowledge ratio [21] and improve their prediction accuracy.
Maturity models serve as a useful tool for better comprehending current capability levels, establishing goals for continuous improvement and evolving project prediction capabilities.
The quantitative risk analysis (QRA) maturity model shown in the figure 6 illustrates the idea that, ultimately, risk intelligent strategies can help organizations employ relevant risk signals, to such a degree, that they are able to comprehend when their cost of risk management exceeds a point of decreasing returns.
In a project risk management context, experimentation and application of Davenport’s principle of competing on analytics [22] should equate to a data-driven, risk-based competitive advantage, for Owners or contractors.
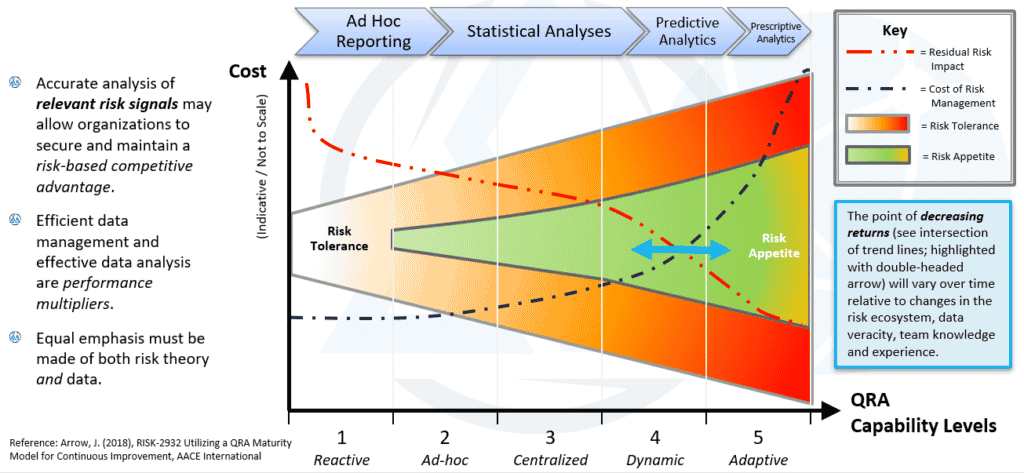
Figure 6 – Quantitative Risk Analysis Maturity Model
Summary
Rapid digitalization in the coming years can deliver huge benefits. However, the ease with which new tools can be purchased and employed poses a risk that they are applied without proper consideration of both theory and data.
Following the numbers without a broader understanding of cause and effect, could deliver insight that is “worse than useless” [2], leading to misdirection and self-inflicted harm.
Certified risk professionals, trained to perform risk management capability assessments can aid organizational planning for continuous improvement, helping improve the quality and effective application of relevant risk data.
Arguably, relevant risk signals are a capstone performance multiplier, building upon earlier advances that start with expanding the reach of commonly held risk theory (i.e., risk management culture) that, in turn, drives an awareness and need for higher quality risk data (see figure 7).
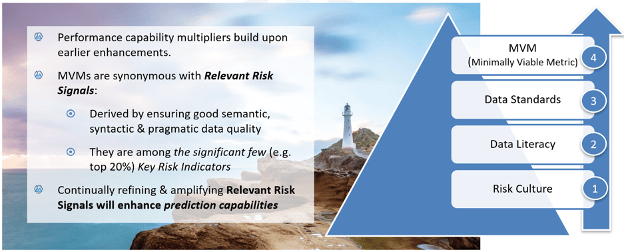
Figure 7 – Relevant Risk Signals as Capstone Performance Capability Multipliers
In much the same way that risk intelligent strategies appeared beyond the reach of many before the era of big data, within the next decade, we should expect organizations to employ deep learning models to better refine and amplify their relevant risk signals, optimize their risk exposure and secure a risk-based competitive advantage.
References
[1] J. Arrow, A. Markus, V. Singh, C. Ramos and S. Bakker, “RISK-2926 Project Controls & Data Analytics in the era of Industry 4.0,” in Conference Transactions, Morgantown, WV, 2018.
[2] D. W. Hubbard, The Failure of Risk Management: Why It’s Broken and How to Fix It, New Jersey: Wiley, 2020.
[3] B. Flyvberg, “What You Should Know about Mega projects and Why: An Overview,” Project Management Journal, vol. 45, no. 2, pp. 6-19, 2014.
[4] S. L. Savage, The Flaw of Averages: Why We Underestimate Risk in the Face of Uncertainty, New Jersey: Wiley, 2009.
[5] Booz Allen Hamilton Inc., “Field Guide to Data Science: Understanding the DNA of data science,” December 2015. [Online].
[6] D. Apgar, Risk Intelligence: Learning to Manage What We Don’t Know, Boston, MA: Harvard Business Press, 2006.
[7] F. Funston and S. Wagner, Surviving and Thriving in Uncertainty: Creating the Risk Intelligent Enterprise, Hoboken, NJ: John Wiley & Sons, 2010.
[8] D. Ariely, Predictably Irrational: The Hidden Forces That Shape Our Decisions, New York, NY: Harper Perennial, 2009.
[9] R. Thaler, Misbehaving: The Making of Behavioral Economics, New York, NY: W. W. Norton & Company, 2015.
[10] D. T. Hulett and J. Arrow, “RISK-3822 Principles for Quantitative Risk Management,” in AACE International Technical Paper, Morgantown, WV, 2022.
[11] CATO Institute, “The Data Detective: Ten Easy Rules to Make Sense of Statistics,” 18 February 2021. [Online].
[12] T. Harford, The Data Detective: Ten Easy Rules to Make Sense of Statistics, London: Riverhead Books, 2020.
[13] D. Kahneman, Thinking, Fast and Slow, New York, NY: Farrar, Straus and Giroux, 2011.
[14] Wikimedia Foundation, Inc., “Motivated reasoning,” Wikipedia, 1 April 2022. [Online].
[15] B. Flyvbjerg and e. al, “Five Things You Should Know about Cost Overrun,” Transportation Research Part A: Policy and Practice, vol. 118, no. December, pp. 174-190, 2018.
[16] P. G. D. Tetlock, Superforecasting: The Art and Science of Prediction, New York, NY: Crown Publishing Group, 2015.
[17] A. Grant, Think Again: The Power of Knowing What You Don’t Know, New York, NY: Viking, 2021.
[18] T. I. Ireland, “Reference Class Forecasting, Guidelines for National Roads Projects,” 2020. [Online]
[19] J. Arrow, “RISK-2929 Improving Risk Management Effectiveness by Testing Risk Relevance,” in AACE International Technical Paper, Morgantown, WV, 2018.
[20] NASA , “Risk Management Handbook SP-2011-3422,” National Aeronautics and Space Administration , Washington, DC, 2011.
[21] R. G. McGrath and I. C. MacMillan, Discovery-Driven Growth, Boston, MA: Harvard Business Review Press, 2009.
[22] T. H. Davenport, Competing on Analytics: The New Science of Winning, Boston, MA: Harvard Business Review Press, 2007.
About the Author, James Arrow:

With more than 20 years’ professional experience, James has played a key role in successfully delivering critical capital assets, in a variety of locations, around the world.
Having had the opportunity to work with diverse teams across the globe, James is well-versed on project best practices and applies exceptional communication skills to lead multi-disciplinary teams.
An effective hands-on team-player, James is also an acclaimed writer and speaker on topics concerning project risk management, data analytics, data science, including digital disruption in the engineering and construction sector.
In recent years, on several occasions, James has been formally recognized by his peers for his contributions to the profession.




![[Free 90-min Masterclass] The Ultimate Leadership Recipe for Project Professionals](https://www.projectcontrolacademy.com/wp-content/uploads/2024/08/4-1024x576.jpg)
