You might have heard about Power BI and its capabilities to connect with various project data sources and the live data.
Power BI, this open-source powerful visual data analytics service offered by Microsoft, provides interactive visualizations and business intelligence capabilities with an interface simple enough to create your project reports and dashboards. Click here to learn more about Power BI.
Power BI effectively unifies data from many sources to create actionable insights which can help you drive your project outcomes.
Now you might ask….
What types of data sources I can connect to Power BI?
Is Power BI compatible with the project management software that I use? Can I connect my existing software (e.g. P6, MS Project, SAP, Project Controls software….) to Power BI for producing dynamic graphical reports and real-time data analytics?
What is the overall Power BI data connection process to various data sources? Do I need similar WBS or special coding structure to connect and integrate various data sources to Power BI to create consolidated interactive dashboards?
Well, let’s go ahead and answer some of these Power BI data connection questions that you might be having in this video interview with a Power BI SME, Jeancarlo Duran Maica.
Power BI Data Connection- Types of Data Sources that Can be Connected
Ultimately, if you were to start using Power BI and leveraging its features, you would want to connect your project live data sources to the software.
But what kind of data sources and formats can you connect with Power BI?
This is probably the first and foremost question that most of us have.
The good news is that Power BI offers this capability to connect to a large list of different data sources and data formats, from Excel to database and even online services!
Some of the data sources you can connect with Power BI are shown in the image below:
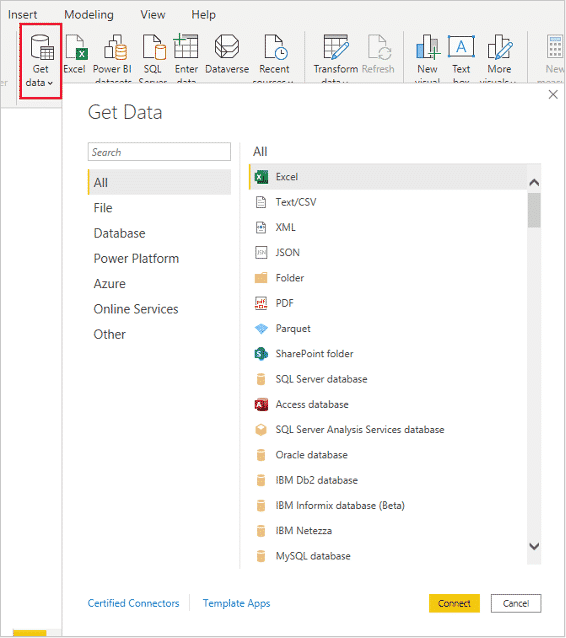
For an exhaustive list of all the possible data connectors which Power BI offers, click here.
As you can see, the list contains almost all the software’s or databases that we use for our projects.
So, whether you are using Primavera P6 or MS Project or SAP, Power BI offers all the APIs by default to connect all these external data sources, making this process even more straightforward for you.
Not finding your data source?
Power BI gives you the freedom to create your APIs. But this won’t be necessary since APIs of the majority of all the software’s and online services that we use daily are already available on Power BI.
Power BI Data Connection- Integrating Different Data Sources with Power BI
Are you currently struggling to integrate all the data from different sources on your excel sheet?
Perhaps, your finance team is using SAP; you as a planner might be using Primavera P6.
Again, Power BI has made things so simple that we don’t have to struggle to integrate and analyze data from different data sources you are receiving from each department.
Amazingly, Power BI allows you to combine all the data from these sources, analyze them and convert them into meaningful insights through interactive dashboards and reports.
The capability of connecting different data sources and integrating all of them on one platform to create a single source of truth is the most significant advantage of using Power BI over any other software. So, no more instances where you have to refer to multiple platforms or excel workbooks to figure out what’s happening with your project.
You now have the possibility of just creating one integrated interactive report.
Sounds interesting enough?
The Power BI Data Connection Process
Now let’s go one level up and start exploring the process of connecting these data sources to Power BI.
A question that can come up here is, ” How do we integrate all these data sources on one platform? Do we need to follow a uniform WBS or coding structure so that the software can process it?”
The answer is yes.
The foundation of your database is vital so that Power BI can read and analyze data between the different sources, integrate them and convert them into a single report.
I recommend that you follow prescribed standards from AACE or PMI to define your process and create uniformity between all the data sources you are currently using in your project.
While making that strategy can seem like a daunting task for you, it’s a one-time thing before you get into Power BI. This will help you save countless hours that you would have otherwise spent on just consolidating all the data from various sources on a weekly or monthly basis.
Now let’s dive into the steps of connecting data to Power BI.
Step 1: Data Shaping with Power Query
Power Query is the data connection and preparation technology that enables you to import and reshape data and manipulate them to the way you would want.
Imagine a situation where the data sent to you from the costing department in your project does not align with the standards you have defined for the various data sources in your project. What do you do then?
Thankfully Power BI has this covered. Power Query allows you to make those required changes within the Power BI platform. The best thing is that once you enable this, each time you receive the data from that department, Power Query automatically transforms that data using all the previously defined steps.
So, once Power Query has shaped your data, you can start using it.
All you need to do is, go to the top menu in Power BI and click on the “Transform Data” button.
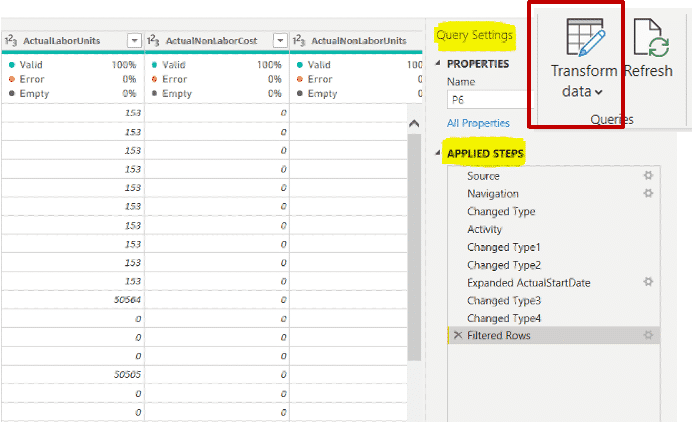
You can then add the different steps required to transform the data to the way you want it.
Step 2: Data Modeling with Power Pivot
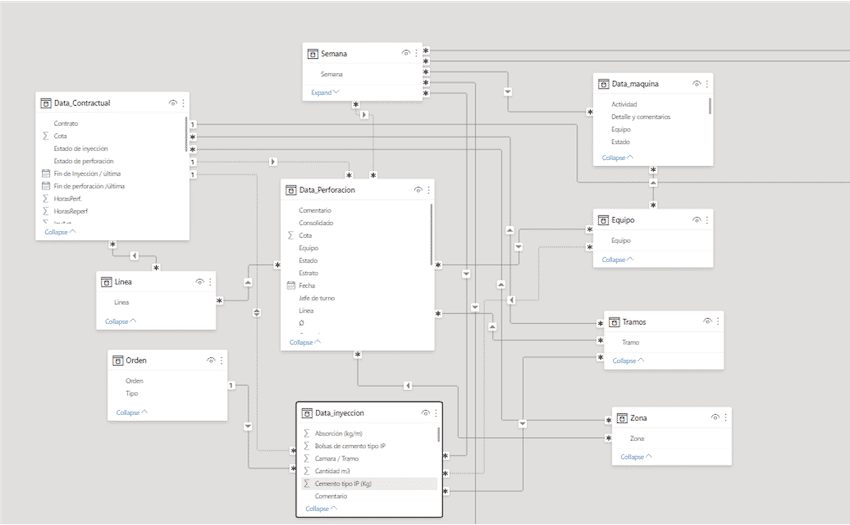
Now that you have shaped your data, the next logical step is to establish a relationship between all these data sources to connect and integrate them.
To do this, you will need to learn some basic coding, but again shouldn’t be a big deal if you are already an advanced user of MS Excel.
Step 3: Data Visualization with Power BI
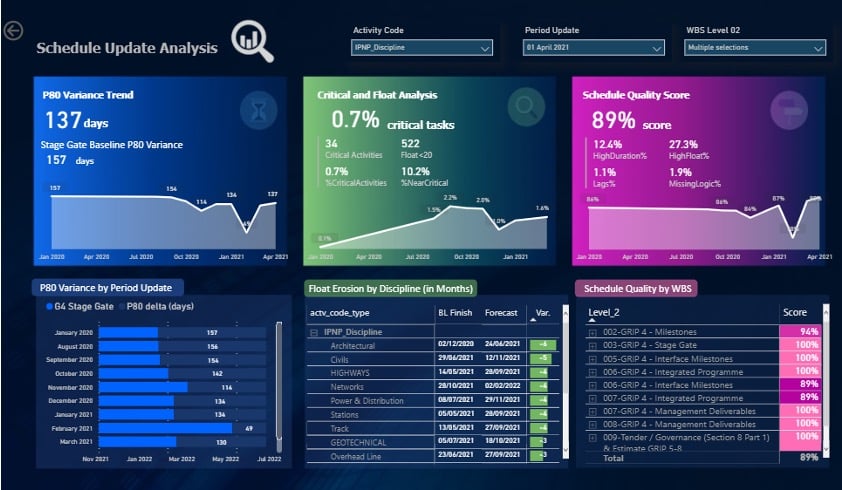
Now that you have all your data shaped and relationships established, you can start analyzing and visualizing your insights in the form of highly impactful interactive dashboards.
That’s it!
In Summary
Power BI is a powerful tool that can integrate your project data from various sources and data formats.
With the 3 simple steps, data shaping, data modeling, and data visualization, Power BI enables you to transform your integrated data from multiple sources into meaningful insights.
While the steps discussed above might seem elaborate, it is simple enough for you to implement them in your project and take your reporting to the next level.
The good news here is that Project Control Academy is here to help you in this journey of mastering Power BI.
Join us for this power-packed hands-on online training workshop on Power BI Visual Data Analytics for Project Controls.
We look forward to being a part of your journey!
About the Writer & Editor, Joel Jacob

With over 6 years of project management experience in the construction industry, Joel is a keen follower of new technologies. Joel has worked across diverse roles in project management, including PMO, project controls, and the customer experience in Kuwait and India. He holds a postgraduate degree in Construction Management and a bachelor’s degree in Civil Engineering.
His true passion is driving people to achieve the best in their careers. Joel is also a certified Project Management Professional (PMP) recognized by the Project Management Institute (PMI) and an accredited LEED Green Associate.
Connect with Joel via LinkedIn.
About the Power BI SME, Jeancarlo Durán Maica

Jeancarlo has impressive capability in all planning & controls disciplines in an array of different project environments including leading large teams & project setup. He holds different professional certifications including Primavera P6 EPPM Implementation Specialist, and MCP (Microsoft Certified Data Analyst Professional).
He has been an active member of AACE International, founding the AACE Peru Section in 2013 and serving on the Board of Directors of AACE International 2017-2019 as Director-Region 10 (Latin America).
Jeancarlo is currently working as a Digital Planning and Reporting Manager for BAM Nuttall on a multi-million pound rail project in the UK (Transpennine Route Upgrade), connecting Manchester to Leeds.
Connect with Jeancarlo on LinkedIn.




![[Free 90-min Masterclass] The Ultimate Leadership Recipe for Project Professionals](https://www.projectcontrolacademy.com/wp-content/uploads/2024/08/4-1024x576.jpg)


