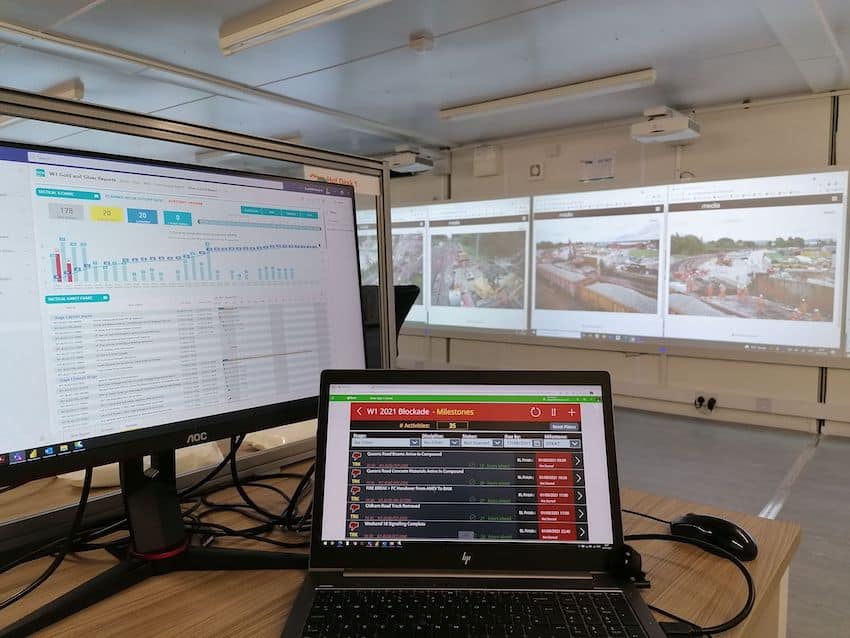
The future for visual data analysts in Project Controls is obviously so bright.
Visual data analytics is no doubt a gateway to the future of project controls and has already become a norm in many companies.
Over the last 10 years or so, the amount of data generated on projects have increased dramatically.
You must be hearing the words “Digital transformation” for quite some time now.
To increase efficiencies and improve project outcomes, companies are investing heavily into specialized software and platforms across different aspects of the project like cost, engineering, procurement, document management, planning, change management, risk management. Well, the list is endless.
With all these solutions implemented by companies to positively impact projects, the amount of data generated has also increased. Data collection, integration and analysis has become tedious tasks, if not a near-impossible one. If you aren’t using all this data to generate actionable insights, then the entire purpose of having all this software’s is gone waste.
To analyze and integrate data from all these sources and generate insights through exciting visuals and interactive dashboards, you need business intelligence tools such as Power BI.
Using Power BI, you can automate your project controls reporting cycle and generate real-time insights for your stakeholders, facilitating faster decision making at the project level.
History of Visual Data Analytics & Emerging Business Intelligence Tools
To understand the importance of visual data analytics using business intelligence tools such as Power BI in your projects, let’s go down the history lane a bit.
The term ‘business intelligence’ or ‘BI’ was first coined and promoted by the former Gartner analyst, Howard Dresner, in 1989. Business intelligence can be defined as:
“A broad category of applications, technologies, and processes for gathering, storing, accessing, and analyzing data to help business users make better decisions.”
Back in the 1990s, if a company wanted a business intelligence tool, they were limited to relying on ERP vendors for a solution. Creating the tool would take months and some serious cash. And after all this effort, the software’s were clunky, complicated for most users to use and didn’t provide the return on investment.
Gone are those days; several companies have since come out with some fantastic open-source business intelligence tools in the past few years.
You no longer need to:
Hire expensive consultants to develop business intelligence solutions for your company.
Spend months going back and forth on the development of the tool.
Struggle with a complicated and non-customizable interface.
Today, business intelligence solutions give the power at your fingertips to start leveraging your project data and automate your project reporting to create a single source of truth.
At the forefront of this, all is, of course, Microsoft Power BI which was first launched by Microsoft in 2013 as add-ins in Excel. This later was developed into a separate tool and launched in September 2013 as Power BI for Office 365.
Now for 14th year in a row, Microsoft Power BI has emerged as a leader in Business Intelligence tools.
Isn’t it time to leverage business intelligence tools in our projects?
Future of Visual Data Analysts in Project Controls

Companies today across the globe are leveraging business intelligence tools to increase efficiencies in their reporting.
Lenovo and Pepsi Co reported a 90% improvement in reporting efficiency after implementing a business intelligence tool.
Several construction firms have started utilizing Power BI for managing their projects better. Titan Construction in the US began using the tool to streamline their project and manage their resources better.
Another example is the TRU West Alliance in the UK. Utilizing business intelligence tools now has become the new standard for project controls reporting within the TRU Alliance in providing real-time communication to the team.

The trend of companies implementing BI tools like Power BI is bound to increase in the coming years, especially in industries like construction. Companies have started to realize the positive effect that these tools can have on their project.
Soon it will become a standard for all project control professionals to leverage the business intelligence tools in automating their project reporting cycle and creating real-time reports, visual data analytics, and dashboards.
So, it’s essential that you, as a project controls professional, stay ahead of the curve and be the one to transform the reporting system in your project.
Job Prospects for Visual Data Analysts & Power BI Experts

This would be a question on your mind. Ultimately, you would want to know how this would affect your career as a project control professional.
The fantastic news is that more and more companies are looking out for project controls professionals with skills in Power BI.
As you can see in a video interview with the Power BI SME, Jeancardo Duran Mica, more than 30,000 visual data analyst vacancies in the UK require Power BI as a skill.
The demand will keep increasing in the future, and very soon, companies will adopt this as a standard skillset expected out of project controls professionals.
Well, are you ready to take that step now and become a master of Power BI?
How to Get Recognized as a Visual Data Analyst?
Getting recognized as a visual data analyst will not happen overnight. You need months if not years mastering the craft and becoming proficient in utilizing the business intelligence tools such as Power BI.
To get started as a visual data analyst, have the following tips in mind:
Move away from Excel mentality and focus on “Datasets” and “Databases”
Most of you might be used to working with excel. However, the concepts of Power BI are slightly different. In Power BI, we need to consider data as sets and not individual rows and columns.
So, when you apply a formula within Power BI, this applies to the entire matrix, including all columns and rows.
Understand your project needs
You should talk to your stakeholders and figure out the information that would help them to make better decisions. You can only then tailor your visual dashboards and reports to meet your stakeholders’ needs and positively impact your project.
Be confident and explore
Be fearless. Download the Power BI Desktop (it’s free) and start exploring today. Understand that Power BI is for ordinary folks like you and me and not a tech geek!
Think positively and take that first step towards mastering Power BI and elevating your career!
Get official training and move ahead of the curve
As stated earlier, there is high demand for visual data analysts in Project Controls, and yet finding such qualified candidates is a challenge.
NOW, It’s the BEST TIME to learn new business intelligence tools such as Power BI.
Don’t waste your time spinning your wheels with a dozen of random tactics. The quickest way to get started is to take a hands-on training.
If you are interested in having a step-by-step guide, proven and practical tools & techniques, and a tailored hands-on approach to the application of Power BI in Project Controls, you may consider the highly practical online training organized by Project Control Academy, Power BI Visual Data Analytics for Project Controls.
You can stand out from the crowd simply by creating interactive dashboards that provide real-time insights into your projects’ performance at the click of a button- something that your colleagues have not seen or thought possible.
Join this highly practical and step-by-step training and pave the path to visual data analytics; this high-in-demand and much-needed field.
In-Summary
There is no doubt that visual data analysts will be in such a high demand soon. Companies have started realizing the advantages of having business intelligence tools such as Power BI to make sense of all the data and convert them into meaningful and powerful insights.
All you need to be is confident and take the first step towards being an expert at utilizing these business intelligence tools.
Power BI is free to download, and I encourage you to take that first step today. Head on to the Microsoft App Store and download the free software.
Start taking baby steps today towards mastering visual data analytics. Get trained and move yourself ahead of the competition.
The good news is that Project Control Academy is here to help you in this journey. You are one click away from becoming a visual data analyst. Join this hands-on online training workshop on Power BI Visual Data Analytics for Project Controls and take your career to new heights.
We look forward to being a part of your journey!
Special Thanks!
The team at Project Control Academy thanks Jeancarlo Duran Maica for sharing his knowledge on Power BI in this engaging video interview. Check more details about what the career outlook and & The Future for Visual Data Analysts in this video.
References
- Get Started in Power BI- The Power BI Starter Guide
- An Introduction to Visual Data Analytics with Power BI
- Power BI Data Connection Process- How to Connect Various Project Data Sources to Power BI
- Real Time Project Performance Reporting- Is That Even Possible?
- Demystifying Power BI dashboards! Do you need to be a techie to create one?
- The Best Business Intelligence Tools that Can Take Your Project Reporting to a Whole New Level
- The History of Business Intelligence (the Past)
- Blue Margin Construction Case Study
About the Writer & Editor, Joel Jacob

With over 6 years of project management experience in the construction industry, Joel is a keen follower of new technologies. Joel has worked across diverse roles in project management, including PMO, project controls, and the customer experience in Kuwait and India. He holds a postgraduate degree in Construction Management and a bachelor’s degree in Civil Engineering.
His true passion is driving people to achieve the best in their careers. Joel is also a certified Project Management Professional (PMP) recognized by the Project Management Institute (PMI) and an accredited LEED Green Associate.
Connect with Joel via LinkedIn.
About the Power BI SME, Jeancarlo Durán Maica

Jeancarlo has impressive capability in all planning & controls disciplines in an array of different project environments including leading large teams & project setup. He holds different professional certifications including Primavera P6 EPPM Implementation Specialist, and MCP (Microsoft Certified Data Analyst Professional).
He has been an active member of AACE International, founding the AACE Peru Section in 2013 and serving on the Board of Directors of AACE International 2017-2019 as Director-Region 10 (Latin America).
Jeancarlo is currently working as a Digital Planning and Reporting Manager for BAM Nuttall on a multi-million pound rail project in the UK (Transpennine Route Upgrade), connecting Manchester to Leeds.
Connect with Jeancarlo on LinkedIn.


![[Free 90-min Masterclass] The Ultimate Leadership Recipe for Project Professionals](https://www.projectcontrolacademy.com/wp-content/uploads/2024/08/4-1024x576.jpg)


