Do you know how accurate your schedule forecasts are? Do you measure Schedule Forecast Accuracy?
Have you ever received feedback from the client saying that your schedule forecast is inaccurate or unrealistic? It may have been a perplexing moment for you at that time.
After all, you were doing everything in the project reporting process flow. Such as sitting down with the project team, forecasting the activities for the next month, and pushing that information into the scheduling tool.
Well, sometimes it’s not enough to just do the right things but to do things right. If you want to know how to measure the accuracy of your project schedules, continue reading!
Schedule Delay Drivers
In today’s age, we have self-driving cars, artificial intelligence, and rapidly advancing construction technology. With all the tech why are construction projects still plagued with cost overruns and schedule delays?
According to a report by McKinsey, The Construction productivity imperative, 98% of projects incur cost overruns and schedule delays.
How is this possible when other industries are rapidly increasing performance yet construction is still plagued with the same challenges time over time?
Figure 1: Schedule Forecast Accuracy – A Tool To Mitigate Schedule Delays
With the plague of schedule delays being never-ending let’s take a deep dive into some of the primary drivers to why this plague is still occurring. From working on various projects across varying industries the top 4 drivers to schedule delays that I see over and over again fall into these areas:
1. Poor communication
2. Poor planning
3. Poor performance management
4. Insufficient risk management
Given the 4 drivers listed above the common denominator to all of them can be summed into one word – Visibility. Specifically, visibility of project controls data.
Someone might ask “but I have robust tools and periodic reporting, why am I still having a challenge with improving the four schedule delay pillars listed above?”
Another question to ask is “how do you know the data you are collecting and reporting is giving you the ‘early-warning’”, the very core of what a project controls function provides is accurate?
This is where schedule forecast accuracy comes in.
Schedule Forecast Accuracy
Forecast accuracy, in my opinion, is one of the key metrics often overlooked when evaluating project performance.
We produce schedule reports including variance reports for the period, variances to the baseline, earned value reports, and a plethora of other reports but a core cog that is often missing is an understanding of your schedule forecast accuracy.

Figure 2: What Is Schedule Forecast Accuracy
What does forecast accuracy tell you?
Forecast accuracy tells you how percent accurate over time your project team is able to forecast each status period.
From day 1, a project collects these percentages which can be sliced and diced by activity codes/metadata that is tagged within your schedule. After a few periods, you have the ability to assess how your schedule forecast accuracy is trending. After a few months, you’ll have a wealth of data to understand how accurate your forecast schedules really are.
Why is this important? Well, your forecast feeds into:
- Communication of your schedule
- Your ability to plan what you know
- Understanding your performance and
- Having visibility of what your risks are based on how your forecast accuracy has been trending.
If you don’t know your forecast accuracy you could be communicating bad data, planning based on bad data, managing performance based on bad data, and managing risk based on bad data.
If 6 months into the project your average forecast accuracy is 50% would you communicate that same schedule to your entire project team to manage their activities? Would you run an accurate Monte Carlo risk analysis on that schedule?
If I were to ask you what your inception to date average forecast accuracy on your project is would you readily be able to tell me? Would you have the data even available to calculate?
Setting Up Your Schedule Forecast Accuracy
To set up your schedule forecast accuracy you first must have a periodic schedule update cadence. It doesn’t matter if it’s weekly, bi-weekly, or once a month it just needs to happen periodically and consistently. This probably sounds basic, but surprisingly this is not done consistently on many projects.
Next, with each status, you must snap a baseline or make a copy then export your schedule data for the status period/data date. You will need at least 2 periods to start calculating your forecast accuracy.
Once you have at least 2 periods you can compare your current week to the previous week.
If your current forecast date is the same or better than last week you can consider it a “hit”, otherwise it’s a “miss”.
The percentage of hits vs the total number of activities is your forecast accuracy.
✅ “Hit” = Current Forecast <= Last Period
❌ “Miss” = Current Forecast >= Last Period
🔘 “Forecast Accuracy” = Hit/ Total # of Activities
As you collect more and more periods, you can average and chart your accuracy over time. Ideally, your accuracy should be 90% or better. If you see your accuracy is consistently low or trending downward, you know the data feeding your tools is going to be inaccurate.
If your tools have inaccurate data, all the downstream reporting and communicating of the data will be bad and give the team low visibility of the real issues making the project susceptible to schedule delays and cost overruns.
Bring Data Visualization to Your Schedule Forecast Accuracy
Once you have a few status periods of forecast accuracy data you can help your team leverage this information by making it more consumable in a data visualization tool like Power BI.
To do this you can either tie it to your schedule database or make exports. If you’re unable to link and pull data directly from your schedule database, you can simply link to the data you created in section 3. Otherwise you can link directly to your schedule data and model the data to calculate your forecast accuracy.
Now comes the fun part.
I recommend adding any key activity codes that you would want to slice and dice your forecast accuracy with. For example, if you want to see schedule forecast accuracy by engineering, procurement, construction, or by WBS, by project supervisor, by building, etc. just add or create these activity codes in your schedule. This will make consumption of your forecast accuracy much more consumable.
Next, create charts/visuals showing accuracy by the different codes and accuracy for the entire project over each status period including a line to show your average forecast accuracy.
The next step then would be to create a detailed visual which would include the individual activities that make up the forecast accuracy. You would then want to enable the ability to drill down between the visual charts and the detail. This way team members can hover over a low schedule forecast accuracy and see what the drivers are.
See Fig. 4 below as an example of a schedule forecast accuracy dashboard:
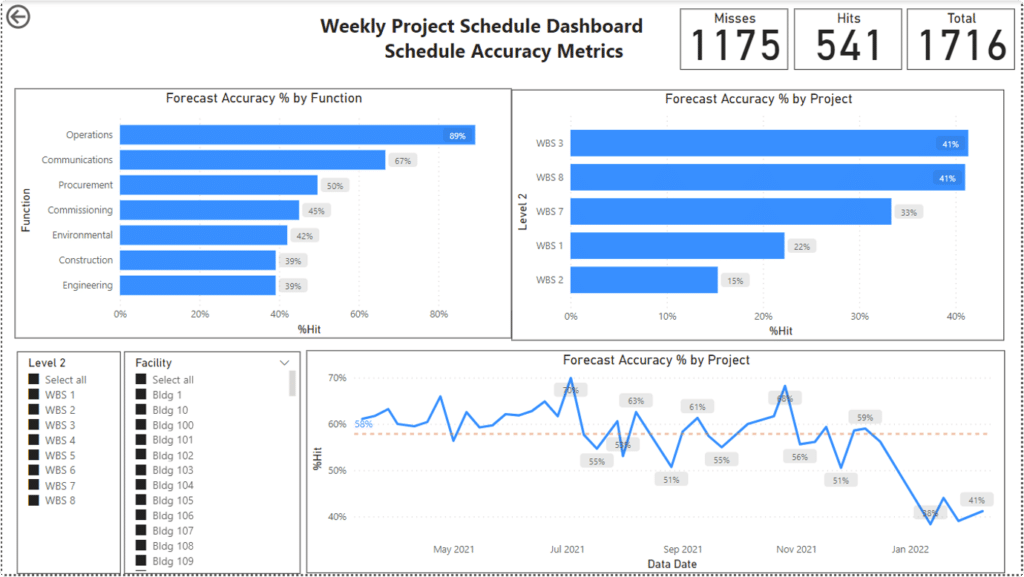
Figure 4: Schedule Forecast Accuracy Dashboard
By observing the schedule forecast accuracy dashboard above, you can easily see how accurate your forecast schedules are. There’s accuracy by Function and by WBS and an overall forecast accuracy over time.
What’s more, project team members can hover over their area of concern, right-click, drill through and see the details driving the accuracy. See Fig. 5 below for an example:
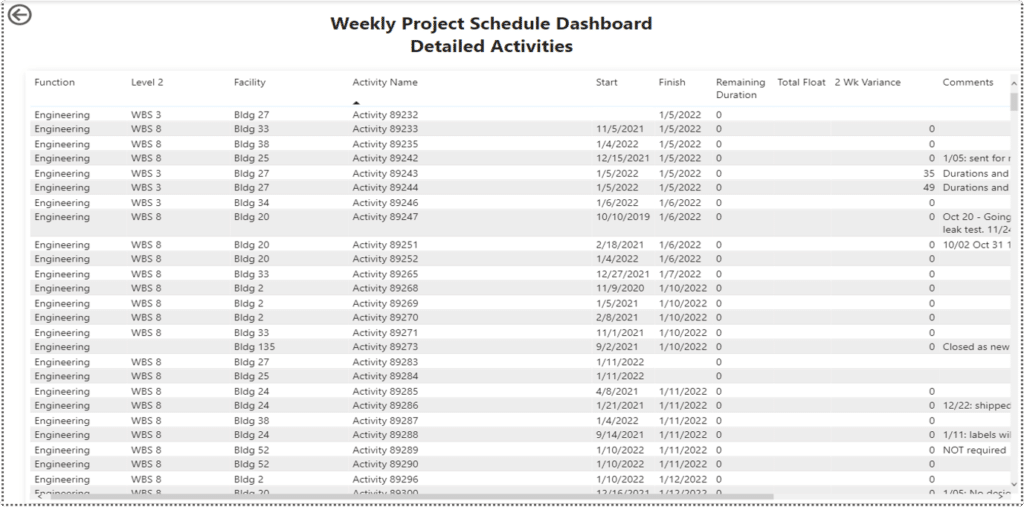
Figure 5: Drill Down Into Areas With Poor Schedule Forecast Accuracy
Interpreting Your Schedule Forecast Accuracy Results
Given the provided examples above you can then determine what areas have problems (i.e. engineering, construction, project x, project y, etc.). The team can then drill down and work to resolve the forecast accuracy issue and stop it in its tracks.
If the schedule forecast accuracy remains low and is trending downward such as in Fig. 6 below, the data feeding your project controls tools and communicated outward to the project will hinder the project’s ability to see the real issues.

Figure 6: Monitor the Schedule Forecast Accuracy Trendline
The Importance of Schedule Forecast Accuracy
There is a saying I like to use when explaining why schedule forecast accuracy is important – you can’t manage what you can’t measure.
If you can’t measure how accurate your forecast accuracy is then you can be feeding data to the most robust project controls platform on the planet and it won’t do the project any good.
You must know your forecast accuracy and how it’s trending so you know if the data going in is going to yield accurate and reliable information out for project team members to act on and act on early.
In Summary:
So now you know how easy it is to measure your schedule forecast accuracy – it’s simply a matter of intent and discipline.
Once you accomplish this task, would you then like to take your schedule forecast accuracy to the next level?
Yes, we are talking about transforming your schedule forecast accuracy into an actionable visualization for your project team members.
Exponentially cut down on decision-making times by bringing the high-level data (with the ability to drill in deeper if required) to the relevant persons on your team! And you can do all this in Power BI!
If this is you, then join us in our highly-acclaimed Power BI Visual Data Analytics for Project Controls training course, to learn how you can set-up data, connect your schedule to Power BI, build interactive schedule and cost dashboards and run up-to-the-minute analytics using Power BI.
About the Author:

Shane has a background in applying project controls solutions across varying industries including nuclear, mining, oil and gas, environmental remediation, government and commercial. He has worked in various roles supporting both the Owners and General Contractors developing robust project controls systems that leverage data to support sound decision-making.
Shane graduated from Washington State University with a BS in Electrical Engineering and is attending Pepperdine University for his MBA.
To connect with Shane, please check his Linkedin profile.



![[Free 90-min Masterclass] The Ultimate Leadership Recipe for Project Professionals](https://www.projectcontrolacademy.com/wp-content/uploads/2024/08/4-1024x576.jpg)


